Analytics
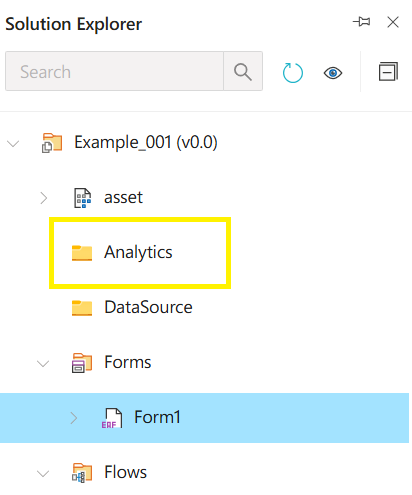
The Analytics folder in the Solution Explorer is a dedicated section of the project structure that is used to organize analytics-related resources. It typically includes elements such as reports, dashboards, and visual components that present data insights within the application.
This folder acts as the central location for managing reusable analytical assets that can be referenced across forms and workflows.
- New Folder
Creates a subfolder inside the asset directory.- Helps organize assets into categories (e.g.,
images,scripts,templates).
- Helps organize assets into categories (e.g.,
Common Contents:
- Reports: Custom reports created for end users or administrators.
- Dashboards: Visual panels that combine multiple data points in a single view.
- Data Charts / Graphs: Configured visual components based on form data or external sources.
- KPIs: Key performance indicators used to monitor business metrics.
Analytics
The Analytics folder is used to store and manage reporting and data visualization components within a Synergy IDE project.